Autoscaling OpenShift Workloads With Custom Prometheus Metrics
November 3, 2022
Kubernetes enables the automated scaling of applications to meet workload demands. Historically only memory and CPU consumption could be considered in scaling decisions, but the OpenShift Custom Metrics Autoscaler operator and KEDA remove that limitation. Read on to learn how OpenShift enables auto scaling based on the metrics that are important to your business.
Understanding OpenShift Monitoring
OpenShift includes monitoring and alerting out of the box. Batteries included.
Metrics are continuously collected and evaluated against dozens of predefined rules that identify potential issues. Metrics are also stored for review in graphical dashboards enabling troubleshooting and proactive capacity analysis.
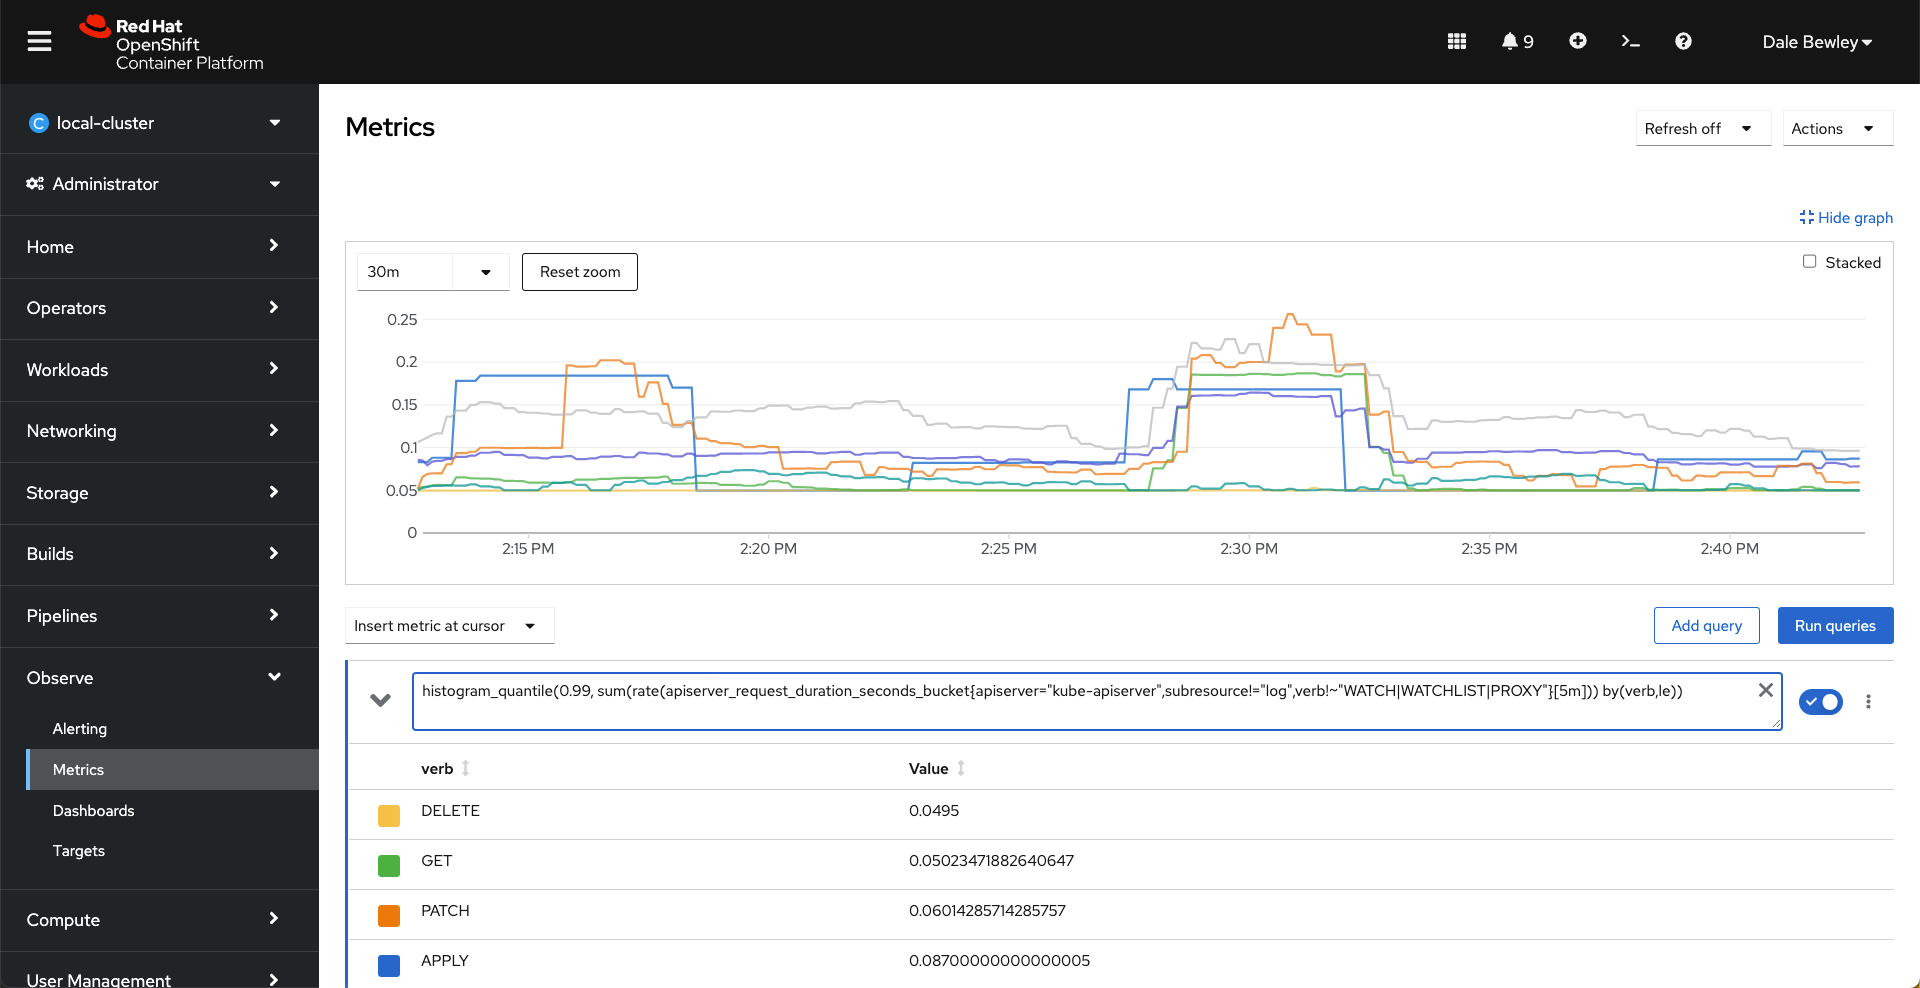
All of these metrics can be queried using Prometheus PromQL syntax in the console at Observe -> Metrics.
OpenShift Metrics Queries
⭐ Pro Tip: Red Hat Advanced Cluster Management aggregates metrics from all your clusters to a single pane of glass. See blog posts with the RHACM tag
What is monitored?
All metrics are collected or “scraped” from Targets which can be found in the console at Observe -> Targets. These targets are defined using ServiceMonitor resources.
$ oc get servicemonitor/kube-state-metrics -n openshift-monitoring -o yaml | yq e '.spec.selector' -
matchLabels:
  app.kubernetes.io/component: exporter
  app.kubernetes.io/name: kube-state-metrics
  app.kubernetes.io/part-of: openshift-monitoring

$ oc get services -l app.kubernetes.io/component=exporter -A
NAMESPACE              NAME                 TYPE        CLUSTER-IP   EXTERNAL-IP   PORT(S)            AGE
openshift-monitoring   kube-state-metrics   ClusterIP   None         <none>        8443/TCP,9443/TCP  6d
openshift-monitoring   node-exporter        ClusterIP   None         <none>        9100/TCP           6d
And there are ServiceMonitors that ship with add-on operators like OpenShift Data Foundation:
$ oc get servicemonitors -n openshift-storage
NAME                                              AGE
noobaa-mgmt-service-monitor                       6d
ocs-metrics-exporter                              6d
odf-operator-controller-manager-metrics-monitor   6d
rook-ceph-mgr                                     6d
s3-service-monitor                                6d
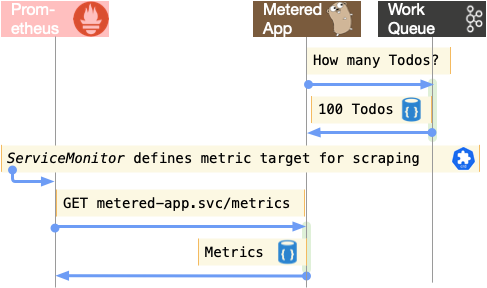
Demo: Listing the ServiceMonitors that define the Prometheus targets
📺 ASCII Screencast
OpenShift monitors dozens of Prometheus targets defined through ServiceMonitors
Understanding Horizontal Pod Autoscaling
Horizontal pod autoscaling (HPA) has been a feature since the earliest days of OpenShift, but scaling was triggered only by CPU and memory consumption metrics. When the average CPU load of pods in an application reached an identified threshold the Deployment or StatefulSet that created the pod was resized to add more pod replicas. When the load receded, the application was scaled down and the extra pods were terminated.
Unfortunately, those simplistic metrics may not tell the whole story for your application.
⭐ Pro Tip: This may remind you of OpenShift Serverless, but the use case differs. KEDA, for example, will only permit you to scale as low as 1 pod. See Knative versus KEDA
Next, we must install the OpenShift Custom Metrics Autoscaler operator which is built on the KEDA project. In addition to installing the operator, a KedaController operand must be created which will result in the deployment of pods to the openshift-keda namespace.
$ oc apply -k operator
namespace/openshift-keda created
kedacontroller.keda.sh/keda created
operatorgroup.operators.coreos.com/openshift-keda created
subscription.operators.coreos.com/openshift-custom-metrics-autoscaler-operator created
# checking the status of KEDA$ oc logs -f -n openshift-keda -l app=keda-operator
Using Custom Metrics Autoscaling
Let’s walk through an example using two applications. One will be the metered app called “prometheus-example-app” which exists only to provide a metric. Imagine this metric describes an amount of work piled up in a queue. The second application called “static-app” actually performs the work, and it will autoscale based on the metric advertised by the metered app.
Enabling Custom Metrics in our Application
Prometheus expects applications to provide a /metrics endpoint which returns data in a format it understands. See the Prometheus docs to get started with instrumenting your application. We’ll use a contrived example app here.
⚠️ Apply the Appropriate Monitoring ClusterRole: Creation of a ServiceMonitor is privileged, so unless you are a cluster admin you may have to request one of the following roles such as monitoring-edit.
monitoring-rules-view grants read access to PrometheusRule custom resources for a project.
monitoring-rules-edit grants create, modify, and deleting PrometheusRule custom resources for a project.
monitoring-edit grants monitoring-rules-edit plus grants creation of new scrape targets for services or pods. This cluster role is needed to create, modify, and delete ServiceMonitor and PodMonitor resources.
Demo:Deploying an example metered application using Kustomize:
$ oc apply -k custom-metric-app
    namespace/keda-test created
    service/prometheus-example-app created
    deployment.apps/prometheus-example-app created
    servicemonitor.monitoring.coreos.com/prometheus-example-monitor created
    route.route.openshift.io/prometheus-example-app created
Understanding ServiceMonitors
Exposing Custom Prometheus Metrics
The OpenShift-monitoring operator automates the configuration of Prometheus using the ServiceMonitor resource to target matching Services and scrape any metrics that are exported at /metrics.
Imagine a case where a metered-app is regularly checking a topic in Kafka to determine the length of a queue of work. We don’t care to scale this application, but we want to use its knowledge to scale another app.
⚠️ Warning: Be sure to name the port in the Service definition and reference this name and not the number in the ServiceMonitor definition! Symptoms include no Target nor metrics visible in Prometheus.
Example ServiceMonitor resource for the metered app
apiVersion:monitoring.coreos.com/v1kind:ServiceMonitormetadata:labels:k8s-app:prometheus-example-monitorname:prometheus-example-monitorspec:endpoints:- interval:30s# use port name NOT port numberport:webscheme:httpselector:matchLabels:app:prometheus-example-app
Deploying A Scaled Application
Another app exists to perform work based on that example work queue. It performs tasks in parallel, so it can benefit from scaling out horizontally.
Notice that we did not create a HorizontalPodAutoscaler above, but one was created automatically using the information in the ScaledObject resource:
$ oc get hpa
NAME REFERENCE TARGETS MINPODS MAXPODS REPLICAS AGE
keda-hpa-static-app Deployment/static-app 0/5 (avg) 1101 14d
Understanding ScaledObjects
Now that a custom metric is being collected, and an app exists which can benefit from the knowledge in this metric to scale more effectively, the two can be joined together using a ScaledObject resource.
Given the inputs of:
an object, such as a Deployment or Statefulset, which can be scaled (line 9)
a trigger of type Prometheus that identifies the relevant metric (line 31)
and authentication credentials to query metrics (line 35)
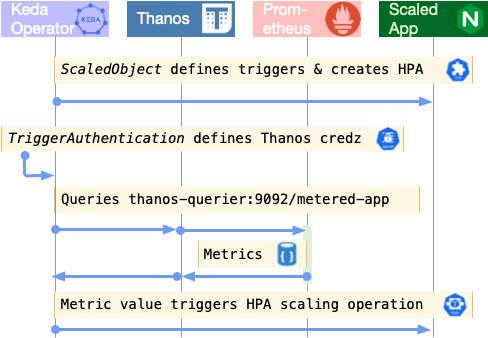
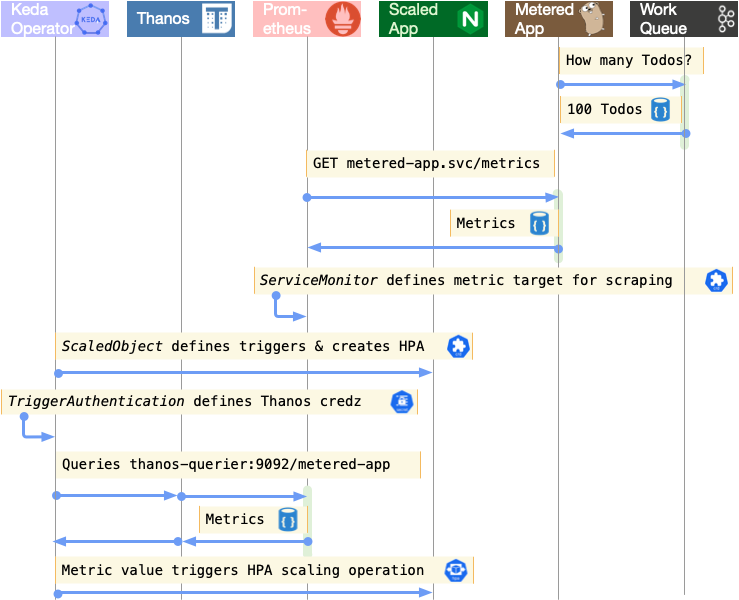
…the operator will use the ScaledObject resource to create and program a HorizontalPodAutoscaler that will be triggered by the results of the Prometheus metrics query.
1apiVersion:keda.sh/v1alpha1 2kind:ScaledObject 3metadata: 4name:scaled-app 5spec: 6scaleTargetRef: 7api:apps/v1 8name:static-app 9kind:Deployment 10cooldownPeriod:20011maxReplicaCount:1012minReplicaCount:113pollingInterval:3014advanced:15restoreToOriginalReplicaCount:false16horizontalPodAutoscalerConfig:17behavior:18scaleDown:19stabilizationWindowSeconds:30020policies:21- type:Percent22value:10023periodSeconds:1524triggers:25- type:prometheus 26metadata:27namespace:keda-test28serverAddress:https://thanos-querier.openshift-monitoring.svc.cluster.local:909229metricName:http_requests_total30# 'job' corresponds to the 'app' label value on deployment31query:sum(rate(http_requests_total{job="prometheus-example-app"}[1m]))32threshold:'5'33authModes:"bearer"34authenticationRef:35name:keda-trigger-auth-prometheus
📓 Notice that the trigger contains a reference on line 35 to the TriggerAuthentication resource.
Understanding Thanos
OpenShift workload monitoring actually introduces a second Prometheus instance distinct from the platform instance, so an intermediary will be used when looking up metrics. This is where Thanos fits in. The CMA or KEDA operator will be looking up metrics values by asking the Thanos-querier for them. You may think of it as a proxy to Prometheus.
The conversation with Thanos must be authenticated, and it is the TriggerAuthentication resource that supplies the credentials. Those credentials are the CA cert and token associated with the thanos service account created by our application deployment.
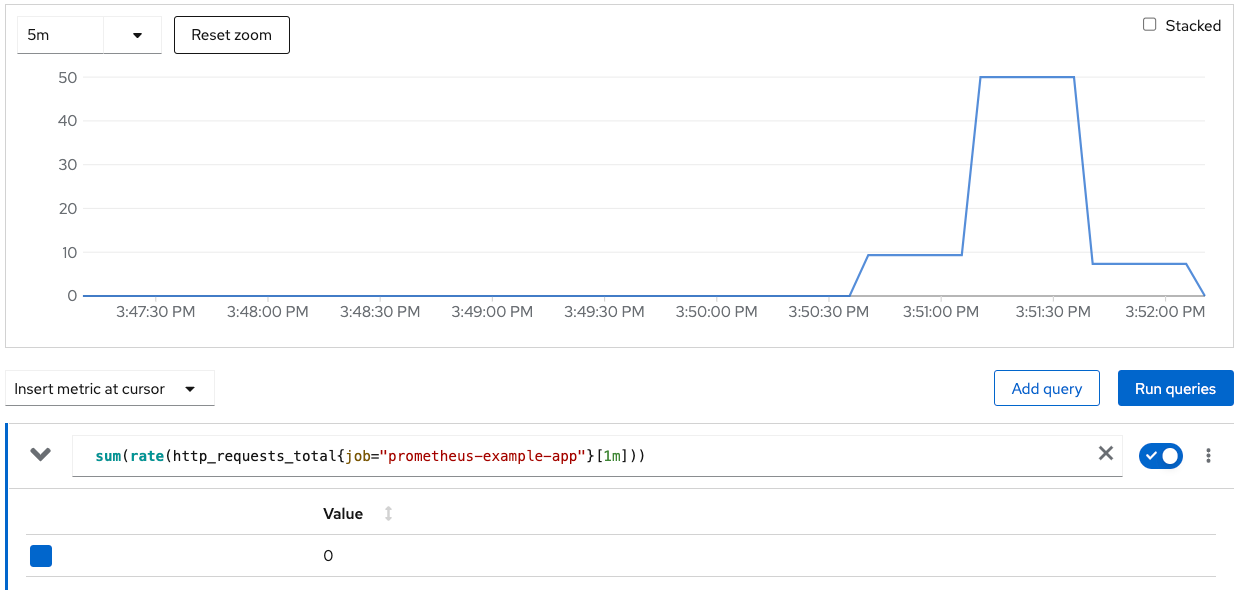
As the rate of HTTP hits to the metered-app increase, the HPA will be triggered and cause the “static-app” to scale out.
Below is a graph of the query, defined by the ScaledOjbect, captured during this demo.
Custom Metric Graph with Load Generator
Demo: Autoscaling one application based on the metrics of another. (output has been sped up)
📺 ASCII Screencast
Scale app "static-app" based on the rate of hits counted in the app "prometheus-example-app"
Summary
So, what did we just learn? TL;DR
OpenShift provides platform and workload monitoring out of the box
Batteries included. The platform ships with Prometheus configured to comprehensively monitor the platform and graph the results.
Developers can add their own metrics to be monitored
Developers can add the Prometheus client libraries to their application, define a ServiceMonitor, and Prometheus will begin scraping them.
Custom metrics can be used in auto scaling triggers
With the addition of the OpenShift Custom Metrics Autoscaling operator, a ScaledObject can program an Autoscaler to resize an application using any metric. You can now scale your application using intelligent metrics that are important to your business!